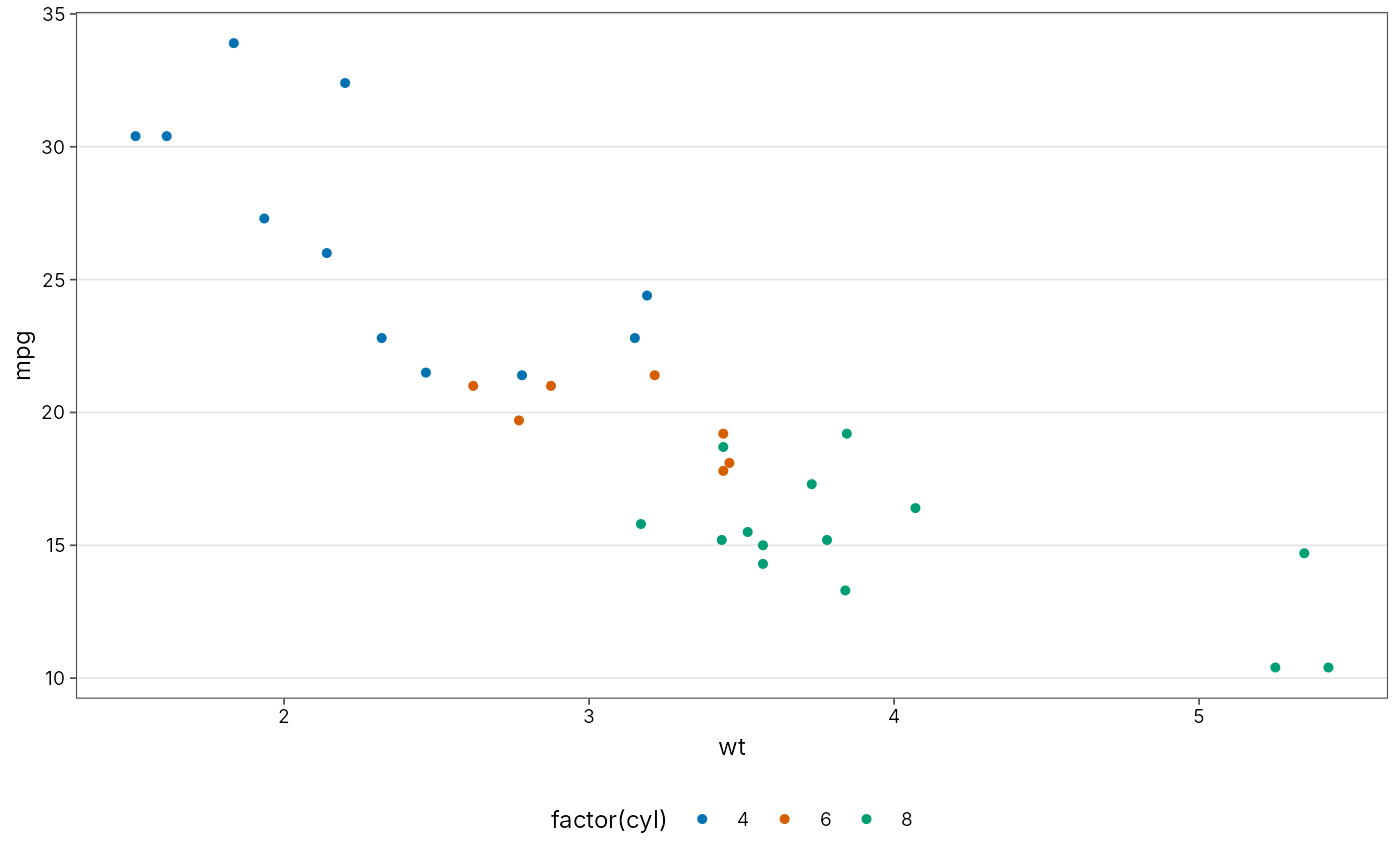
theme_tidydiversity() is a clean ggplot2 theme for journal figures:
white background, light horizontal grid, black text, a legend at the
bottom and plain facet strips. Every autoplot()
method uses it by default, and you can add it to any ggplot.
plot_palette() returns colour-blind-safe colours: the Okabe-Ito palette
(Okabe and Ito 2008) by default, switching to the viridis palette when
more than eight colours are needed, or a greyscale ramp for journals that
print in black and white. scale_colour_tidydiversity() and
scale_fill_tidydiversity() are the matching discrete ggplot2 scales.
Arguments
- base_size
Base font size in points.
- base_family
Base font family.
- legend_position
Legend position, passed to
ggplot2::theme().- grid
Draw major grid lines:
"y","x","xy"or"none".- n
Number of colours.
- palette
"okabe_ito"or"grey".- ...
Passed to
ggplot2::discrete_scale().
References
Okabe, M. and Ito, K. (2008). Color universal design (CUD): how to make figures and presentations that are friendly to colour-blind people. https://jfly.uni-koeln.de/color/