
Case study: frogs along the Mt Wilhelm elevational gradient
Source:vignettes/articles/case-png-frogs.Rmd
case-png-frogs.RmdDahl et al. (2024) recorded 3390 frogs of 55 species at eight sites from 200 to 3700 m on Mt Wilhelm, Papua New Guinea.
Source and licence. Data on Dryad (doi:10.5061/dryad.3n5tb2rqf)
under CC0 1.0. See ?png_frogs and
data-raw/png_frogs.R.
library(tidydiversity)
library(dplyr)
library(ggplot2)
set.seed(2026)
png_frogs
#> # A tibble: 92 x 7
#>    site   elevation species scientific_name       family  reproduction abundance
#>    <chr>      <int> <chr>   <chr>                 <chr>   <chr>            <int>
#>  1 MW0200       200 FR01    Cornufer papuensis    Cerato~ terrestrial        253
#>  2 MW0200       200 FR23    Copiula sp 1          Microh~ terrestrial         29
#>  3 MW0200       200 FR28    Hylophorbus sp 7      Microh~ terrestrial         68
#>  4 MW0200       200 FR30    Mantophryne lateralis Microh~ terrestrial          1
#>  5 MW0200       200 FR32    Oreophryne hypsiops   Microh~ terrestrial         85
#>  6 MW0200       200 FR37    Xenorhina oxycephala  Microh~ terrestrial          8
#>  7 MW0200       200 FR40    Litoria arfakiana     Pelodr~ aquatic              2
#>  8 MW0200       200 FR46    Litoria mucro         Pelodr~ aquatic              4
#>  9 MW0200       200 FR50    Litoria thesaurensis  Pelodr~ aquatic             12
#> 10 MW0200       200 FR51    Papurana arfaki       Ranidae aquatic              9
#> # i 82 more rows
Sampling completeness
div_coverage(png_frogs)
#> # A tibble: 8 x 6
#>   site       n s_obs    f1    f2 coverage
#>   <chr>  <int> <int> <int> <int>    <dbl>
#> 1 MW0200   508    13     1     2    0.998
#> 2 MW0700   503    13     0     0    1
#> 3 MW1200   553    16     1     1    0.998
#> 4 MW1700   449    18     0     1    1
#> 5 MW2200   591    14     3     1    0.995
#> 6 MW2700   495    12     2     0    0.996
#> 7 MW3200   177     4     0     0    1
#> 8 MW3700   114     2     1     0    1
Every site has a sample coverage of at least 99.5%: the frog inventories are close to complete, so observed and estimated richness differ little.
Diversity along the gradient
est <- div_estimate(png_frogs, nboot = 100) |>
  add_site_data(distinct(png_frogs, site, elevation))
ggplot(est, aes(elevation, estimate, colour = factor(q))) +
  geom_pointrange(aes(ymin = lower, ymax = upper)) +
  geom_line() +
  scale_colour_tidydiversity() +
  labs(
    x = "Elevation (m)", y = "Effective number of species",
    colour = "Order q"
  ) +
  theme_tidydiversity()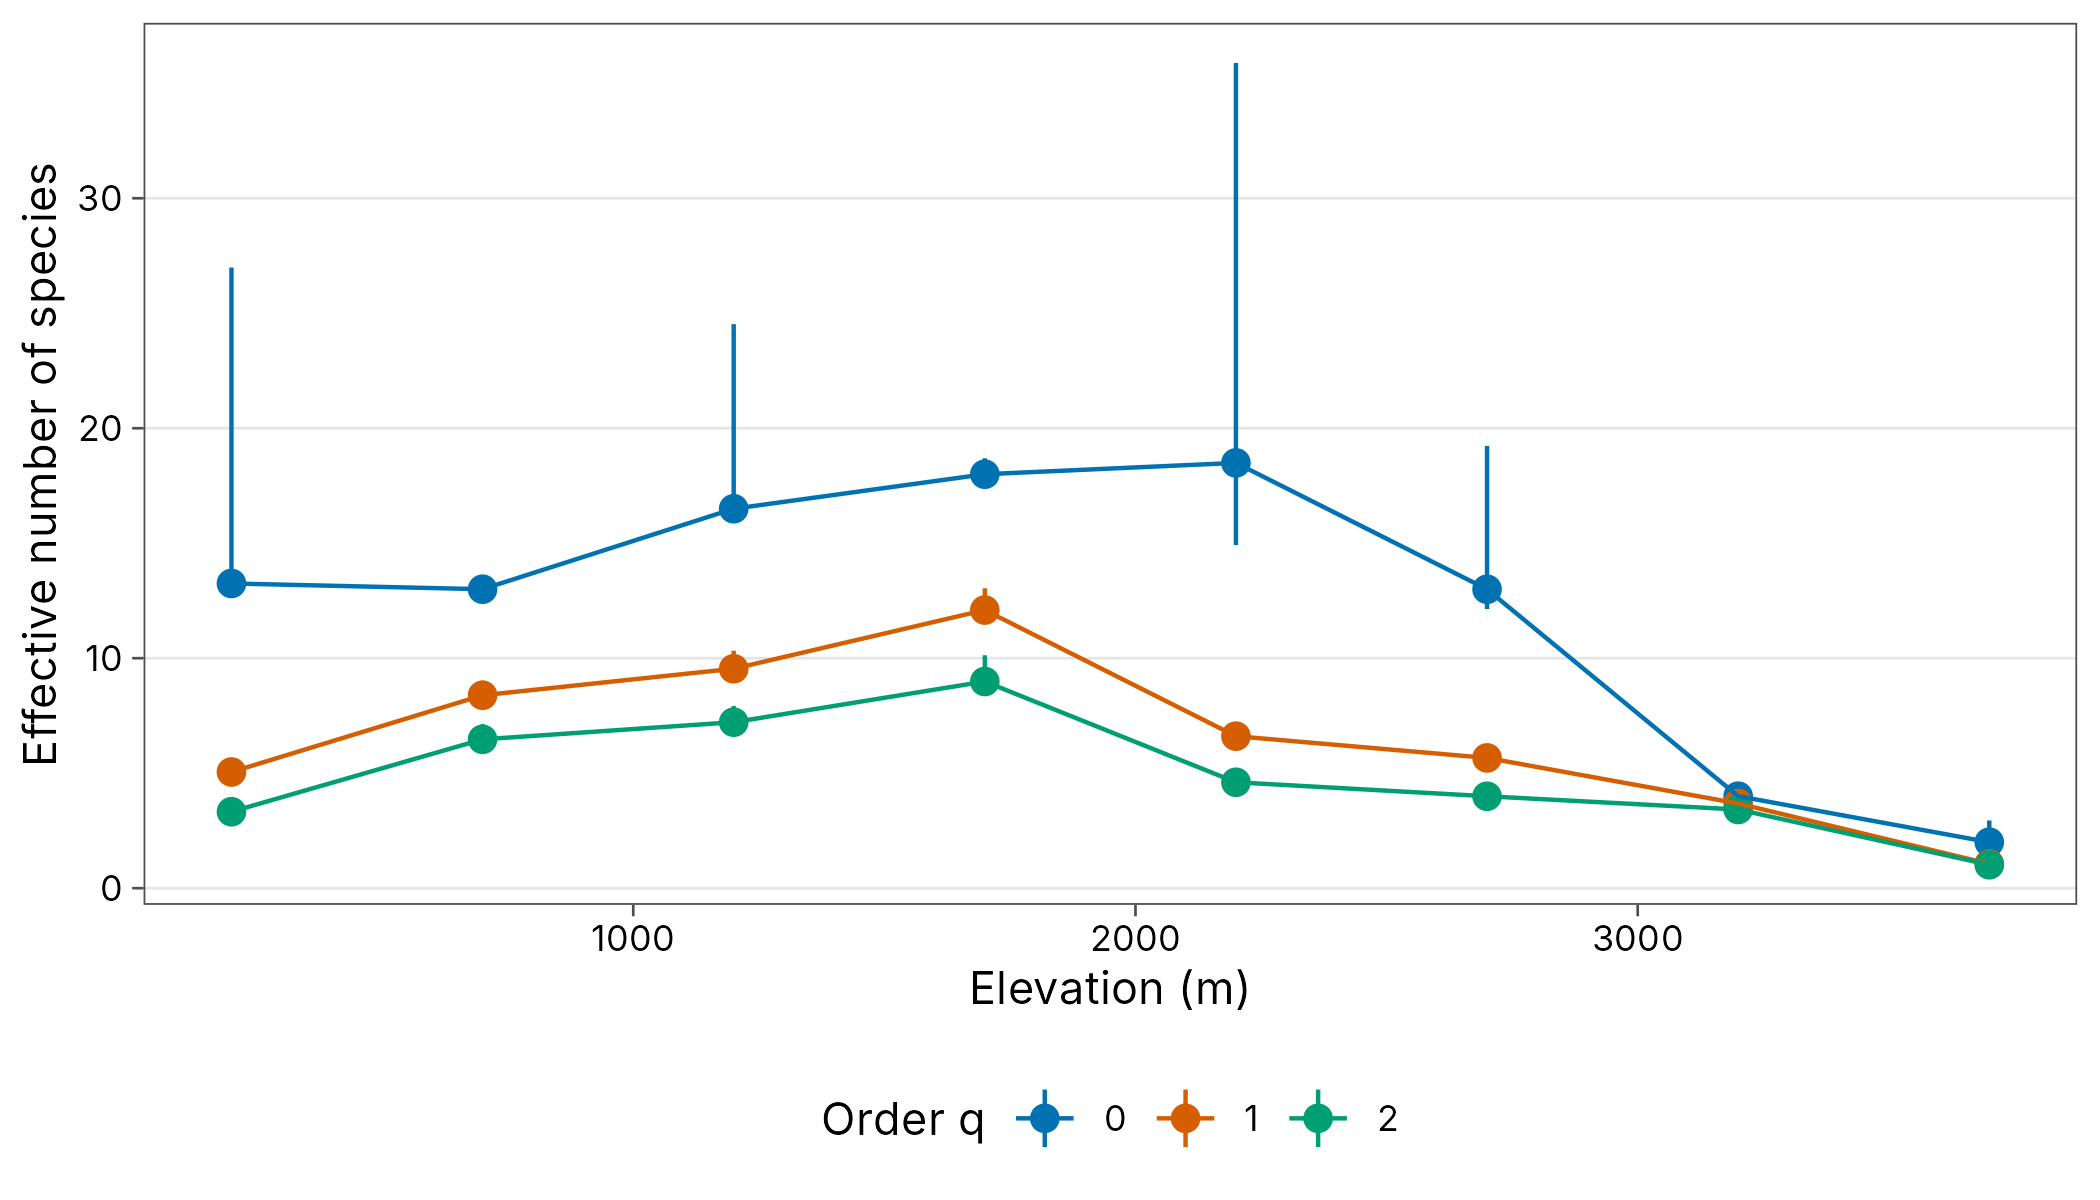
Richness is highest between 1200 and 2200 m and drops to four species at 3200 m and two at 3700 m.
Species turnover
decay <- beta_decay(png_frogs, gradient = elevation)
autoplot(decay)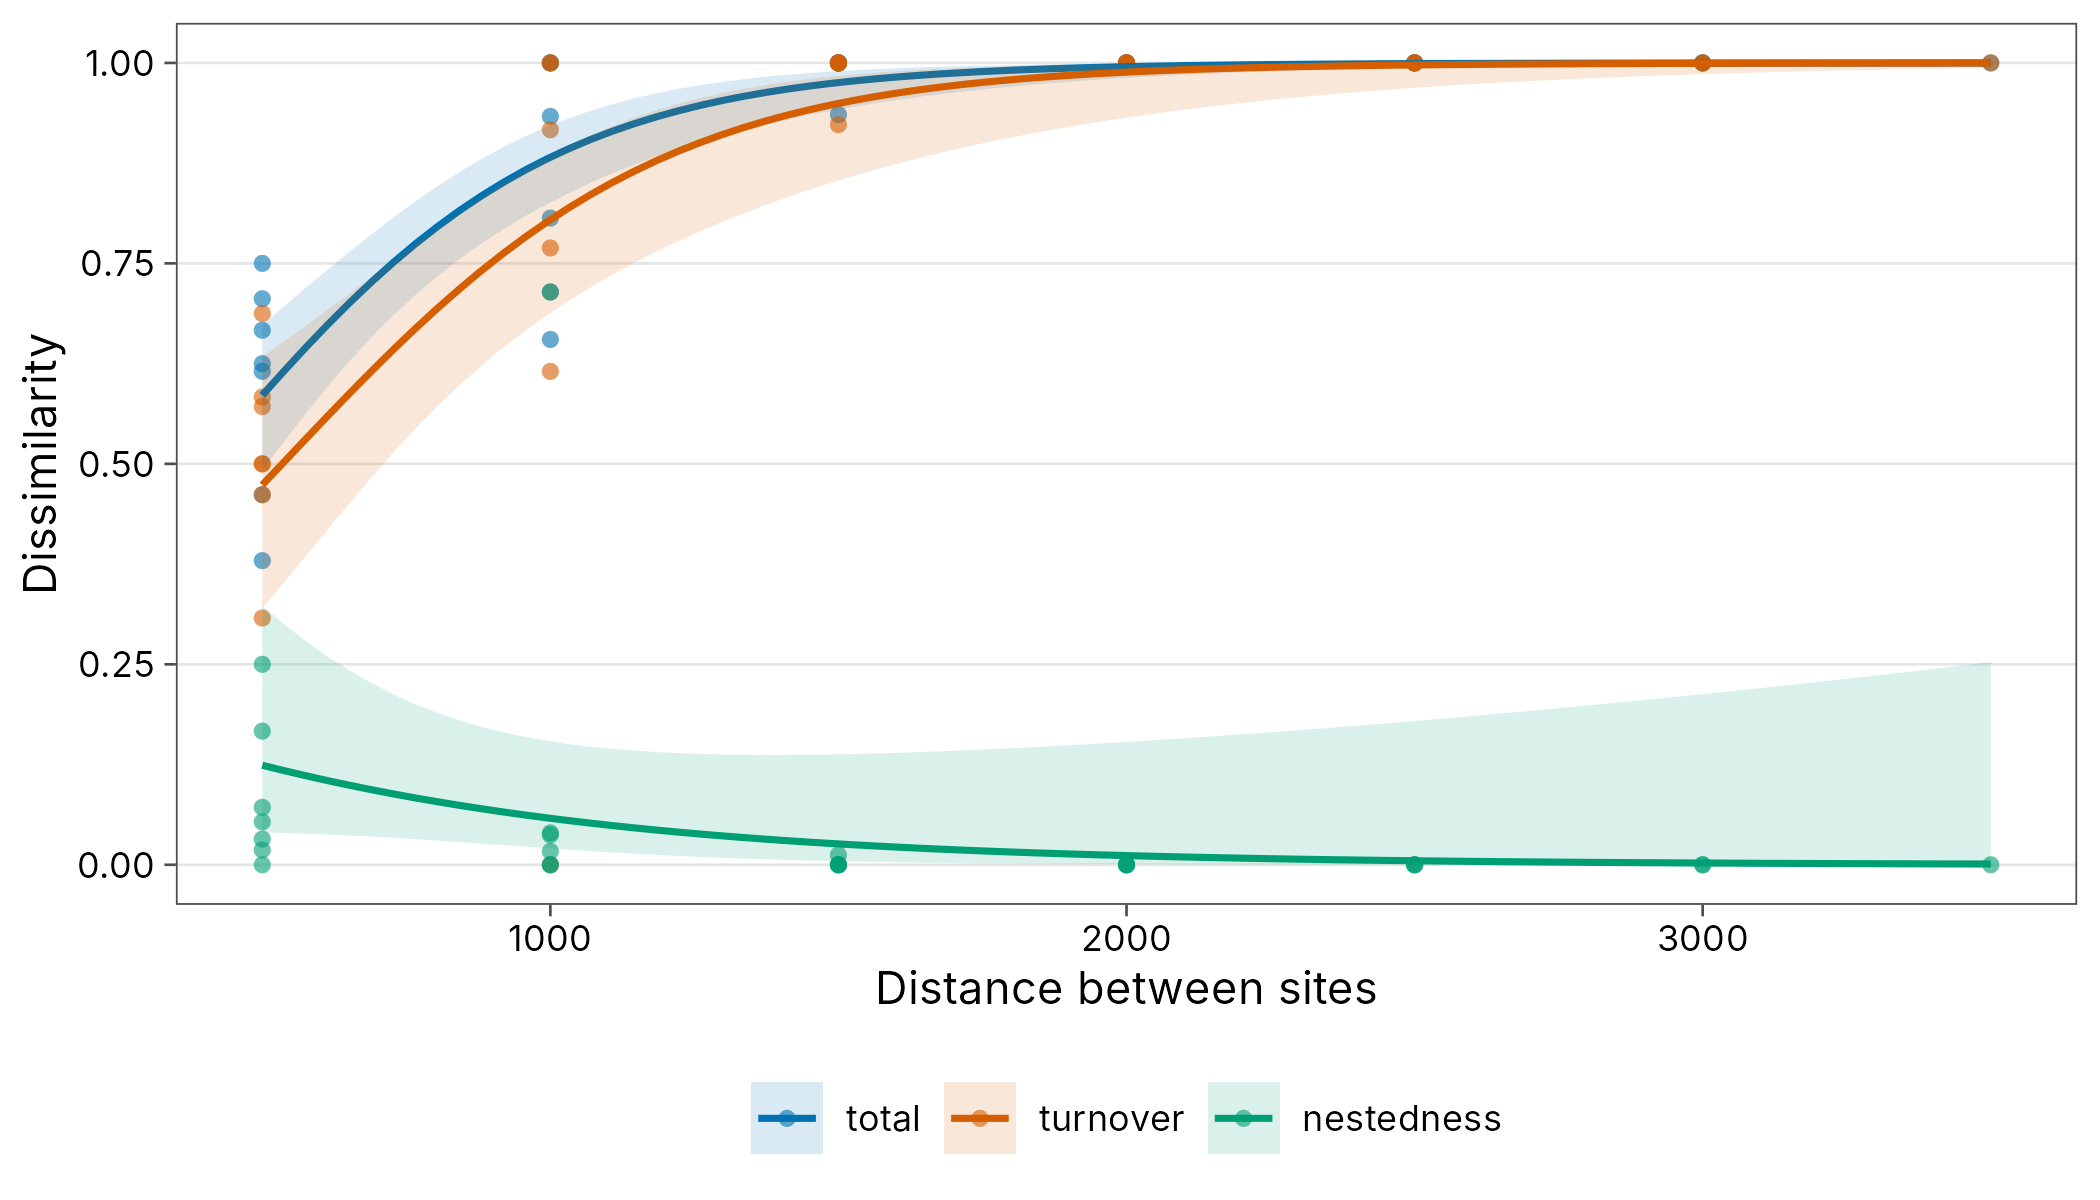
Dissimilarity rises with elevational distance and is almost entirely turnover: species replace one another up the mountain rather than dropping out of nested subsets.
Reference
Dahl, C., Richards, S. J., Basien, I., Mungkaje, A. J. and Novotny, V. (2024). Local and regional diversity of frog communities along an extensive rainforest elevation gradient in Papua New Guinea. Biotropica, 56, 90-97. doi:10.1111/btp.13283