
Case study: butterfly monitoring in the Wanang forest plot
Source:vignettes/articles/case-png-butterflies.Rmd
case-png-butterflies.RmdLuk et al. (2019) counted butterflies on 36 days, three a month over 12 months spread across three years, in the Wanang forest dynamics plot, Papua New Guinea. Repeated sampling of one place suits questions about temporal diversity: how much does a year of monitoring capture, and how different are years?
Source and licence. Data on Dryad (doi:10.5061/dryad.j35fq7r)
under CC0 1.0. Only the Wanang part of the published multi-site data is
included. See ?wanang_butterflies and
data-raw/wanang_butterflies.R.
library(tidydiversity)
library(dplyr)
library(ggplot2)
set.seed(2026)
wanang_butterflies
#> # A tibble: 2,020 x 6
#>    site    day month  year species               abundance
#>    <chr> <int> <int> <int> <chr>                     <int>
#>  1 day01     1     1     1 Apaturina erminea             4
#>  2 day01     1     1     1 Appias celestina              2
#>  3 day01     1     1     1 Cirrochroa regina            14
#>  4 day01     1     1     1 Cyrestis acilia               1
#>  5 day01     1     1     1 Danis danis                  41
#>  6 day01     1     1     1 Danis glaucopis               1
#>  7 day01     1     1     1 Danis regalis                34
#>  8 day01     1     1     1 Dicallaneura decorata         2
#>  9 day01     1     1     1 Elodina hypatia               5
#> 10 day01     1     1     1 Elymnias cybele               6
#> # i 2,010 more rows
Each year of monitoring
Pooling the days within each year gives one sample per year:
years <- mutate(wanang_butterflies, site = paste("Year", year))
div_coverage(years)
#> # A tibble: 3 x 6
#>   site       n s_obs    f1    f2 coverage
#>   <chr>  <int> <int> <int> <int>    <dbl>
#> 1 Year 1  4228   131    27    19    0.994
#> 2 Year 2  4644   158    36    13    0.992
#> 3 Year 3  4369   142    35    17    0.992
div_estimate(years, nboot = 100)
#> # A tibble: 9 x 7
#>   site       q observed estimate     se  lower  upper
#>   <chr>  <dbl>    <dbl>    <dbl>  <dbl>  <dbl>  <dbl>
#> 1 Year 1     0   131      150.    9.33  139.   178.
#> 2 Year 1     1    24.5     25.0   0.590  24.5   26.1
#> 3 Year 1     2     8.69     8.71  0.287   8.69   9.27
#> 4 Year 2     0   158      208.   20.3   181.   266.
#> 5 Year 2     1    35.6     36.4   0.982  35.6   38.4
#> 6 Year 2     2    13.6     13.7   0.451  13.6   14.6
#> 7 Year 3     0   142      178.   17.2   157.   230.
#> 8 Year 3     1    26.4     27.0   0.673  26.4   28.3
#> 9 Year 3     2     9.33     9.35  0.325   9.33   9.99
Each year recorded more than 4000 butterflies with coverage above 99%, yet estimated richness exceeds observed richness by about 20 to 50 species: rare species remain undetected after a full year.
autoplot(div_rarefy(years, q = c(0, 1, 2), knots = 40, nboot = 100))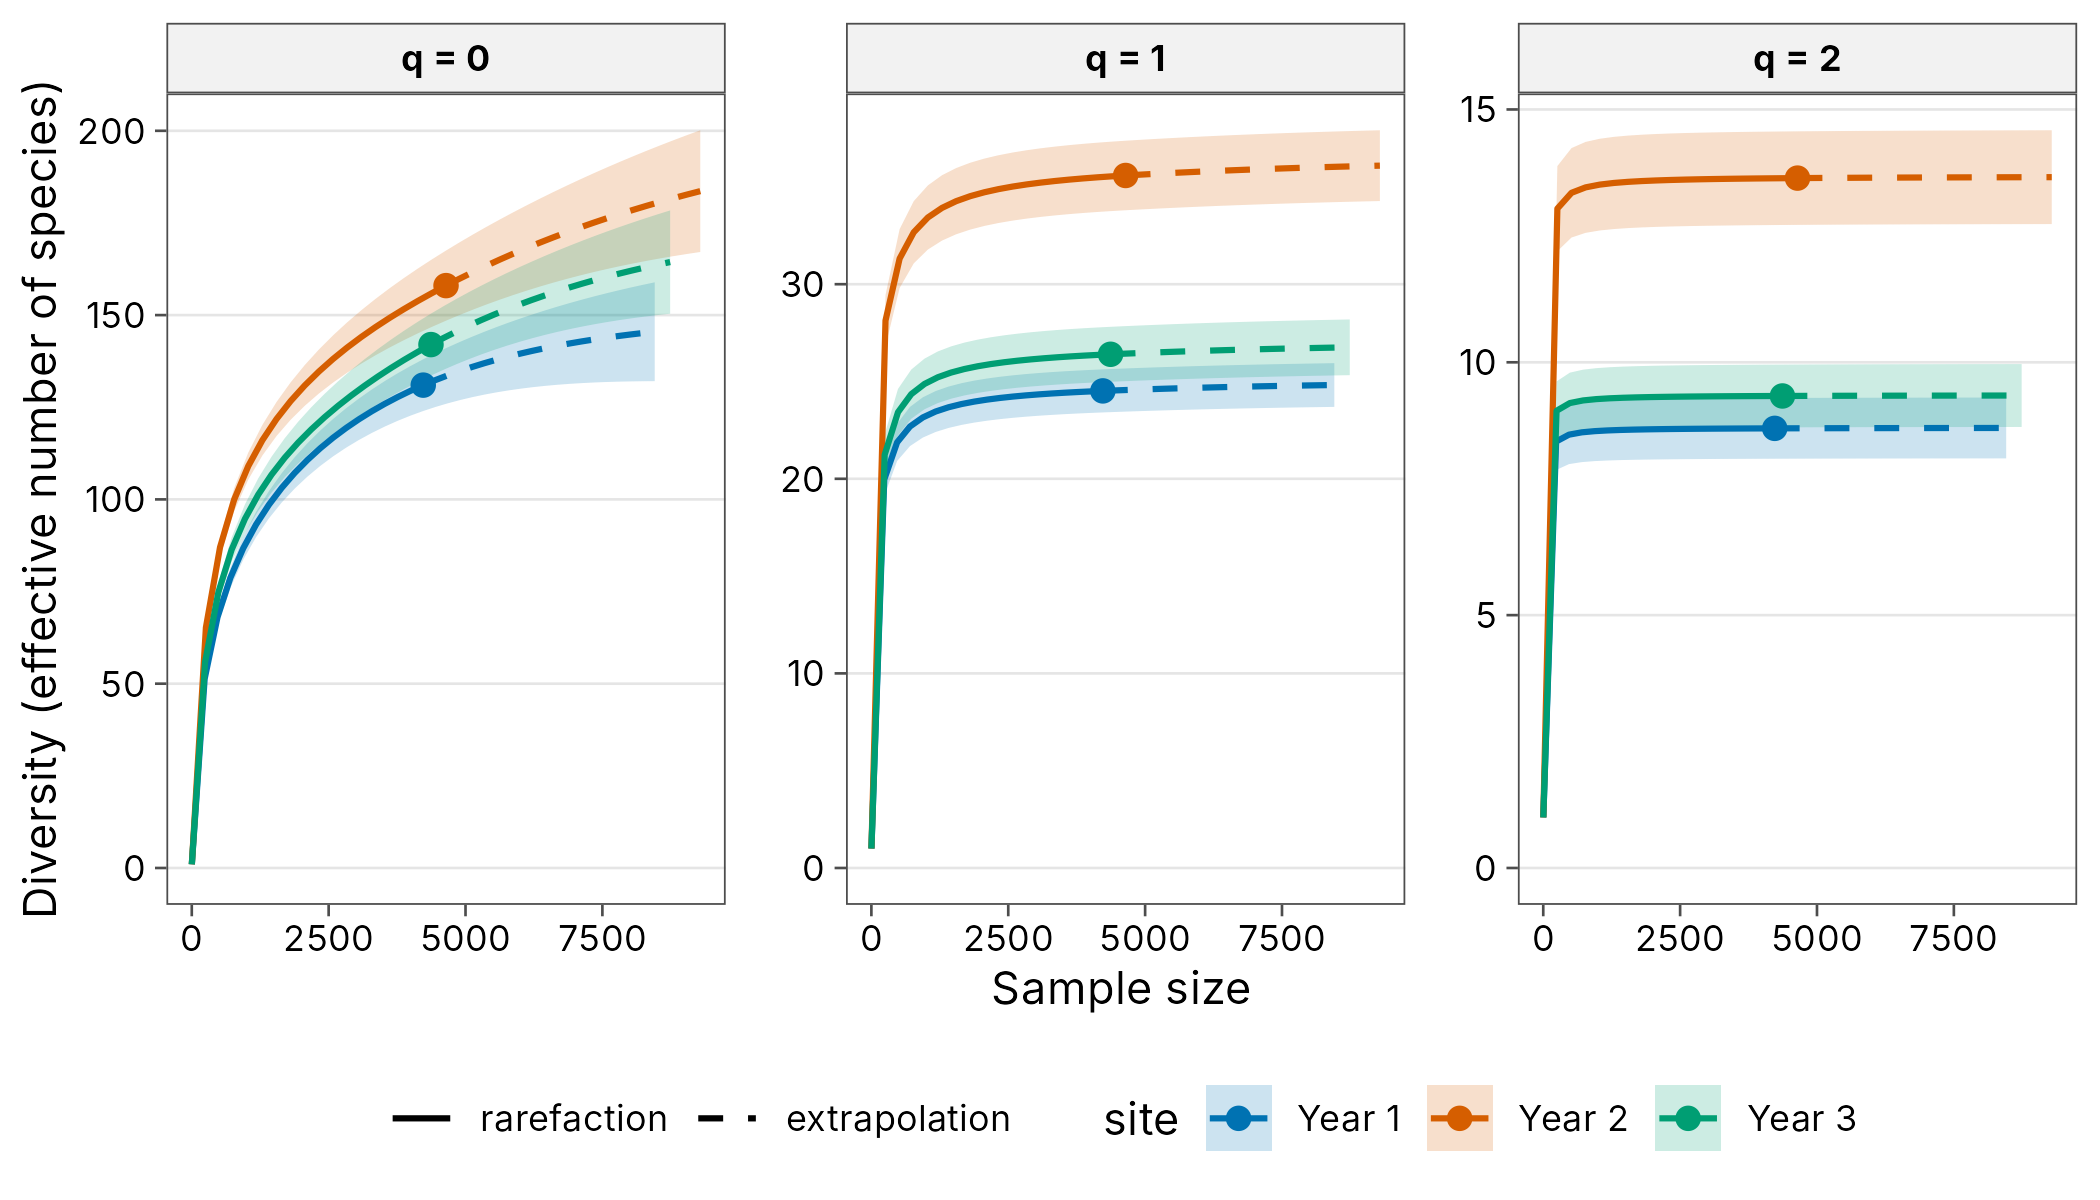
How different are the years?
beta_multi(years)
#> # A tibble: 1 x 4
#>   n_sites turnover nestedness total
#>     <int>    <dbl>      <dbl> <dbl>
#> 1       3    0.209     0.0641 0.273
Most of the difference between years is turnover. Within each year, the four sampled months also differ substantially:
wanang_butterflies |>
  mutate(site = paste("Month", month)) |>
  beta_multi(.by = year)
#> # A tibble: 3 x 5
#>    year n_sites turnover nestedness total
#>   <int>   <int>    <dbl>      <dbl> <dbl>
#> 1     1       4    0.273     0.252  0.524
#> 2     2       4    0.367     0.0759 0.443
#> 3     3       4    0.327     0.108  0.435
These results support the paper’s conclusion that monitoring across several years captures far more of the species pool than any single year.
Reference
Luk, C.-L., Basset, Y., Kongnoo, P., Hau, B. C. H. and Bonebrake, T. C. (2019). Inter-annual monitoring improves diversity estimation of tropical butterfly assemblages. Biotropica, 51, 519-528. doi:10.1111/btp.12671