
Case study: ants along Mt Wilhelm and in rainforest canopies
Source:vignettes/articles/case-png-ants.Rmd
case-png-ants.RmdTwo Papua New Guinea ant datasets show tidydiversity on incidence-type and nest-count data.
Sources and licences. png_ants: Moses
et al. (2023), data deposited on Zenodo (doi:10.5281/zenodo.8191946)
and included with the lead author’s permission.
png_tree_ants: Plowman et al. (2020), data on Dryad (doi:10.5061/dryad.2fqz612k6)
under CC0 1.0. See ?png_ants, ?png_tree_ants
and data-raw/ for how each was built.
Ground ants at baits along Mt Wilhelm
Baits were set at eight elevations from 200 to 3700 m in the dry and
the wet season. Worker counts at a bait reflect recruitment, so each
species at a bait counts as one occurrence (the default when the data
have no abundance column).
png_ants
#> # A tibble: 369 x 12
#>    site  elevation season transect bait  baits bait_type species genus subfamily
#>    <chr>     <int> <chr>     <int> <chr> <int> <chr>     <chr>   <chr> <chr>
#>  1 MW02~       200 dry           1 200_~    60 cho       lepm_0~ Lept~ Dolichod~
#>  2 MW02~       200 dry           1 200_~    60 cho       mono_0~ Mono~ Myrmicin~
#>  3 MW02~       200 dry           1 200_~    60 lipid     phei_0~ Phei~ Myrmicin~
#>  4 MW02~       200 dry           1 200_~    60 lipid     tetr_0~ Tetr~ Myrmicin~
#>  5 MW02~       200 dry           1 200_~    60 amino_ac~ crem_0~ Crem~ Myrmicin~
#>  6 MW02~       200 dry           1 200_~    60 cho_amin~ crem_0~ Crem~ Myrmicin~
#>  7 MW02~       200 dry           1 200_~    60 lipid     crem_0~ Crem~ Myrmicin~
#>  8 MW02~       200 dry           1 200_~    60 cho       crem_0~ Crem~ Myrmicin~
#>  9 MW02~       200 dry           1 200_~    60 cho_amin~ rhyt_0~ Rhyt~ Ectatomm~
#> 10 MW02~       200 dry           1 200_~    60 cho       crem_0~ Crem~ Myrmicin~
#> # i 359 more rows
#> # i 2 more variables: guild <chr>, workers <int>
div_coverage(png_ants, .by = season)
#> # A tibble: 10 x 7
#>    season site       n s_obs    f1    f2 coverage
#>    <chr>  <chr>  <dbl> <int> <int> <int>    <dbl>
#>  1 dry    MW0200    47    16     5     5    0.898
#>  2 wet    MW0200    76    21    11     5    0.857
#>  3 dry    MW0700    23    15    12     1    0.482
#>  4 wet    MW0700    58    28    17     3    0.709
#>  5 dry    MW1200    29    13     7     3    0.766
#>  6 wet    MW1200    57    20     9     3    0.844
#>  7 dry    MW1700    17     5     1     2    0.953
#>  8 wet    MW1700    34    10     6     2    0.827
#>  9 dry    MW2200    13     6     3     1    0.781
#> 10 wet    MW2200    15     5     2     1    0.876
Coverage differs between seasons and sites, so compare richness at equal coverage:
std <- div_standardise(png_ants, q = 0, .by = season, nboot = 100) |>
  add_site_data(distinct(png_ants, site, elevation))
ggplot(std, aes(elevation, diversity, colour = season)) +
  geom_pointrange(aes(ymin = lower, ymax = upper),
    position = position_dodge(width = 80)
  ) +
  geom_line() +
  scale_colour_tidydiversity() +
  labs(x = "Elevation (m)", y = "Richness at equal coverage", colour = NULL) +
  theme_tidydiversity()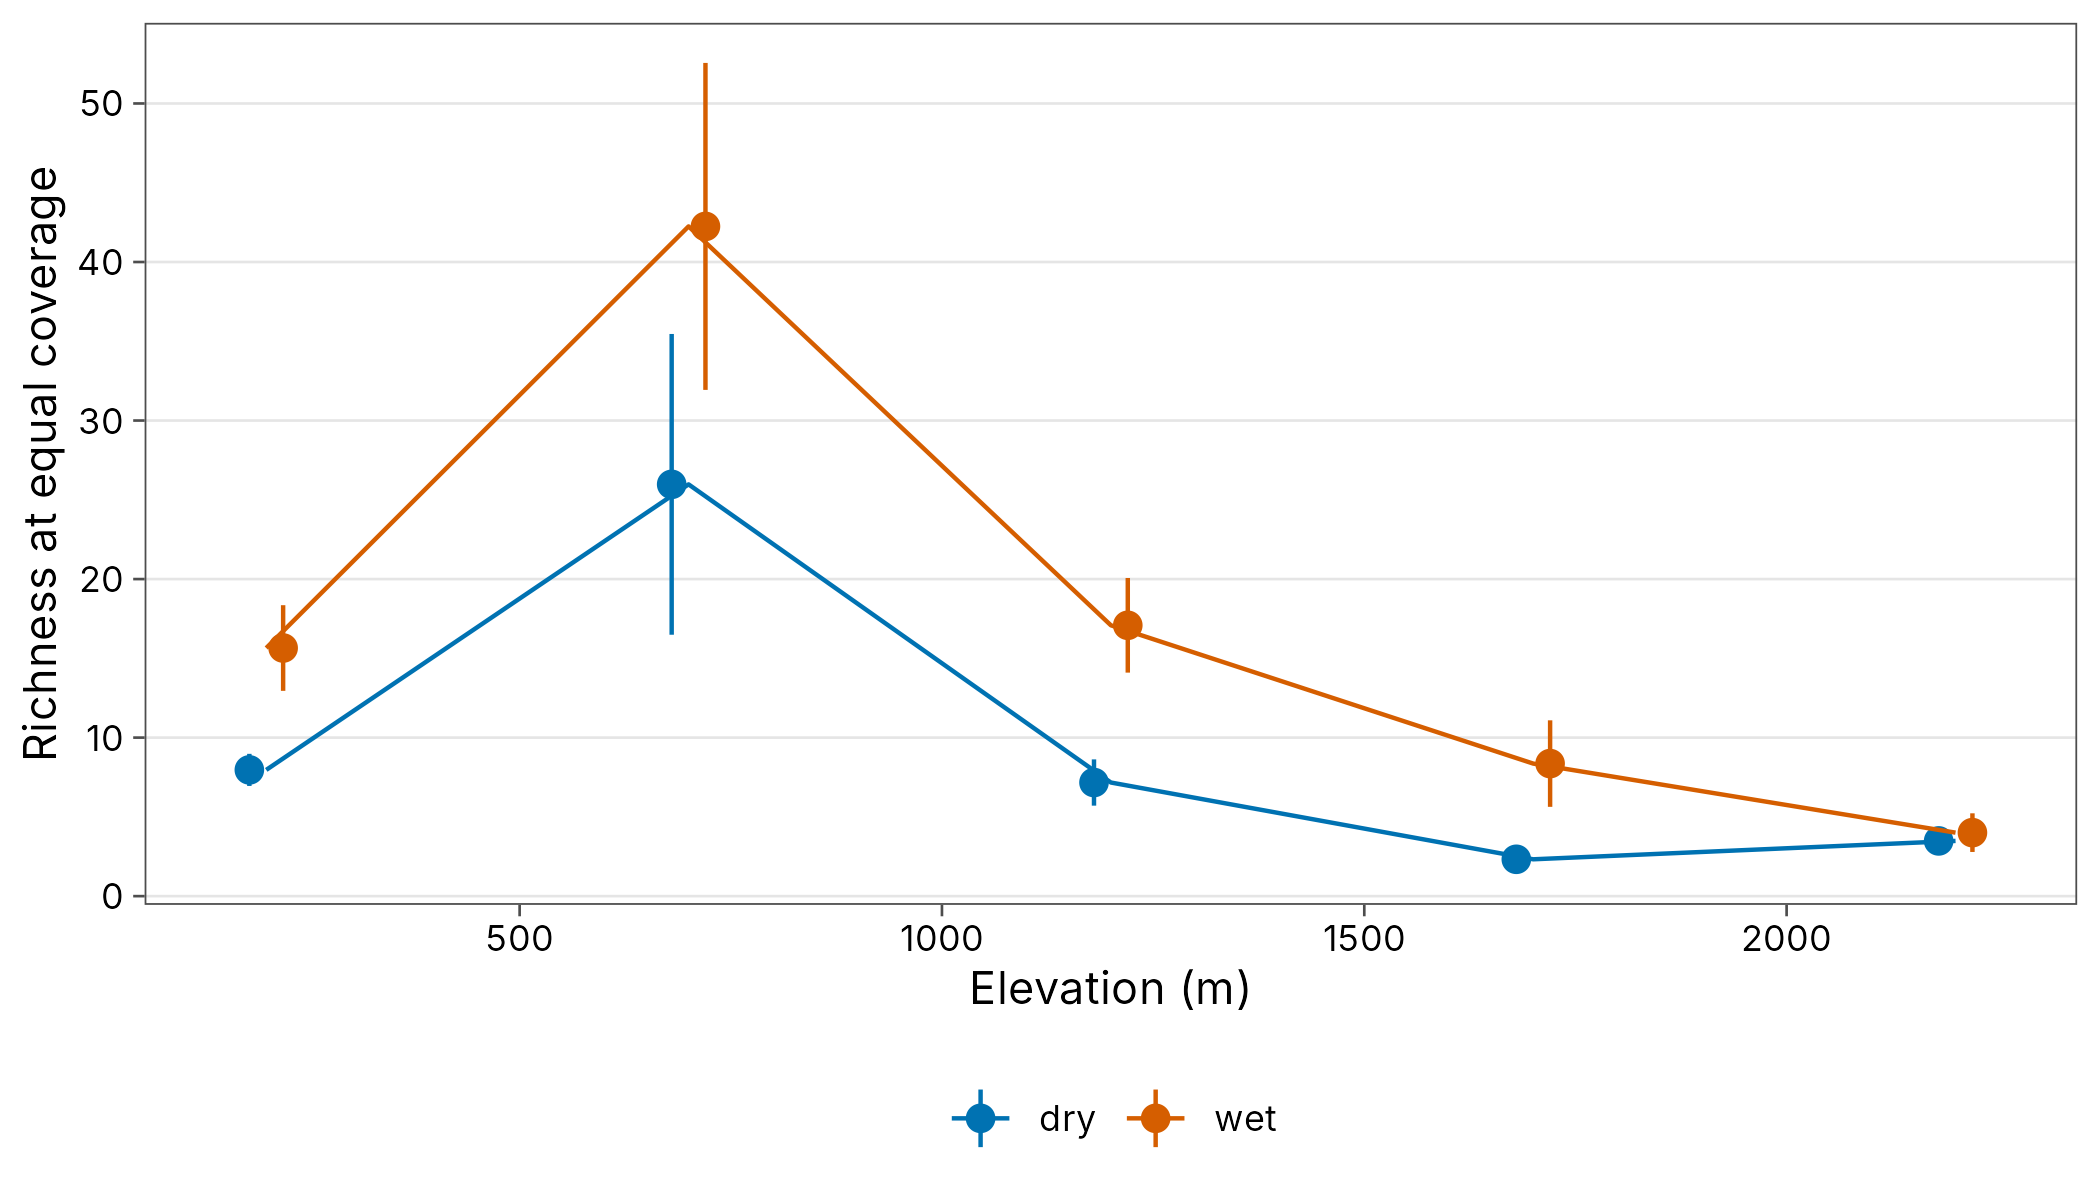
Both seasons cover the same five elevations, 200 to 2200 m (a single
dry-season record at 2700 m is left out of png_ants to keep
the seasons comparable). Richness peaks at low to mid elevation and
falls sharply above 1700 m.
Tree-nesting ants in three forest plots
png_tree_ants lists every ant nest in 1254 trees in
plots at Wanang (200 m), Numba (900 m) and Yawan (1800 m). Using the
number of nests as the abundance and pooling trees within each plot:
est <- div_estimate(png_tree_ants, abundance = nests, nboot = 100)
est
#> # A tibble: 9 x 7
#>   site       q observed estimate     se  lower upper
#>   <chr>  <dbl>    <dbl>    <dbl>  <dbl>  <dbl> <dbl>
#> 1 Wanang     0    85       101.   9.81   90.1  133.
#> 2 Wanang     1    33.5      35.7  1.53   33.5   38.7
#> 3 Wanang     2    17.8      18.1  1.20   17.8   20.5
#> 4 Numba      0   103       124.  10.2   112.   155.
#> 5 Numba      1    49.5      53.6  2.03   49.7   57.6
#> 6 Numba      2    30.1      31.2  1.85   30.1   34.8
#> 7 Yawan      0    22        37.0  9.61   26.7   69.3
#> 8 Yawan      1    12.0      12.4  0.467  12.0   13.3
#> 9 Yawan      2     9.89     10.1  0.404   9.89  10.8
autoplot(est)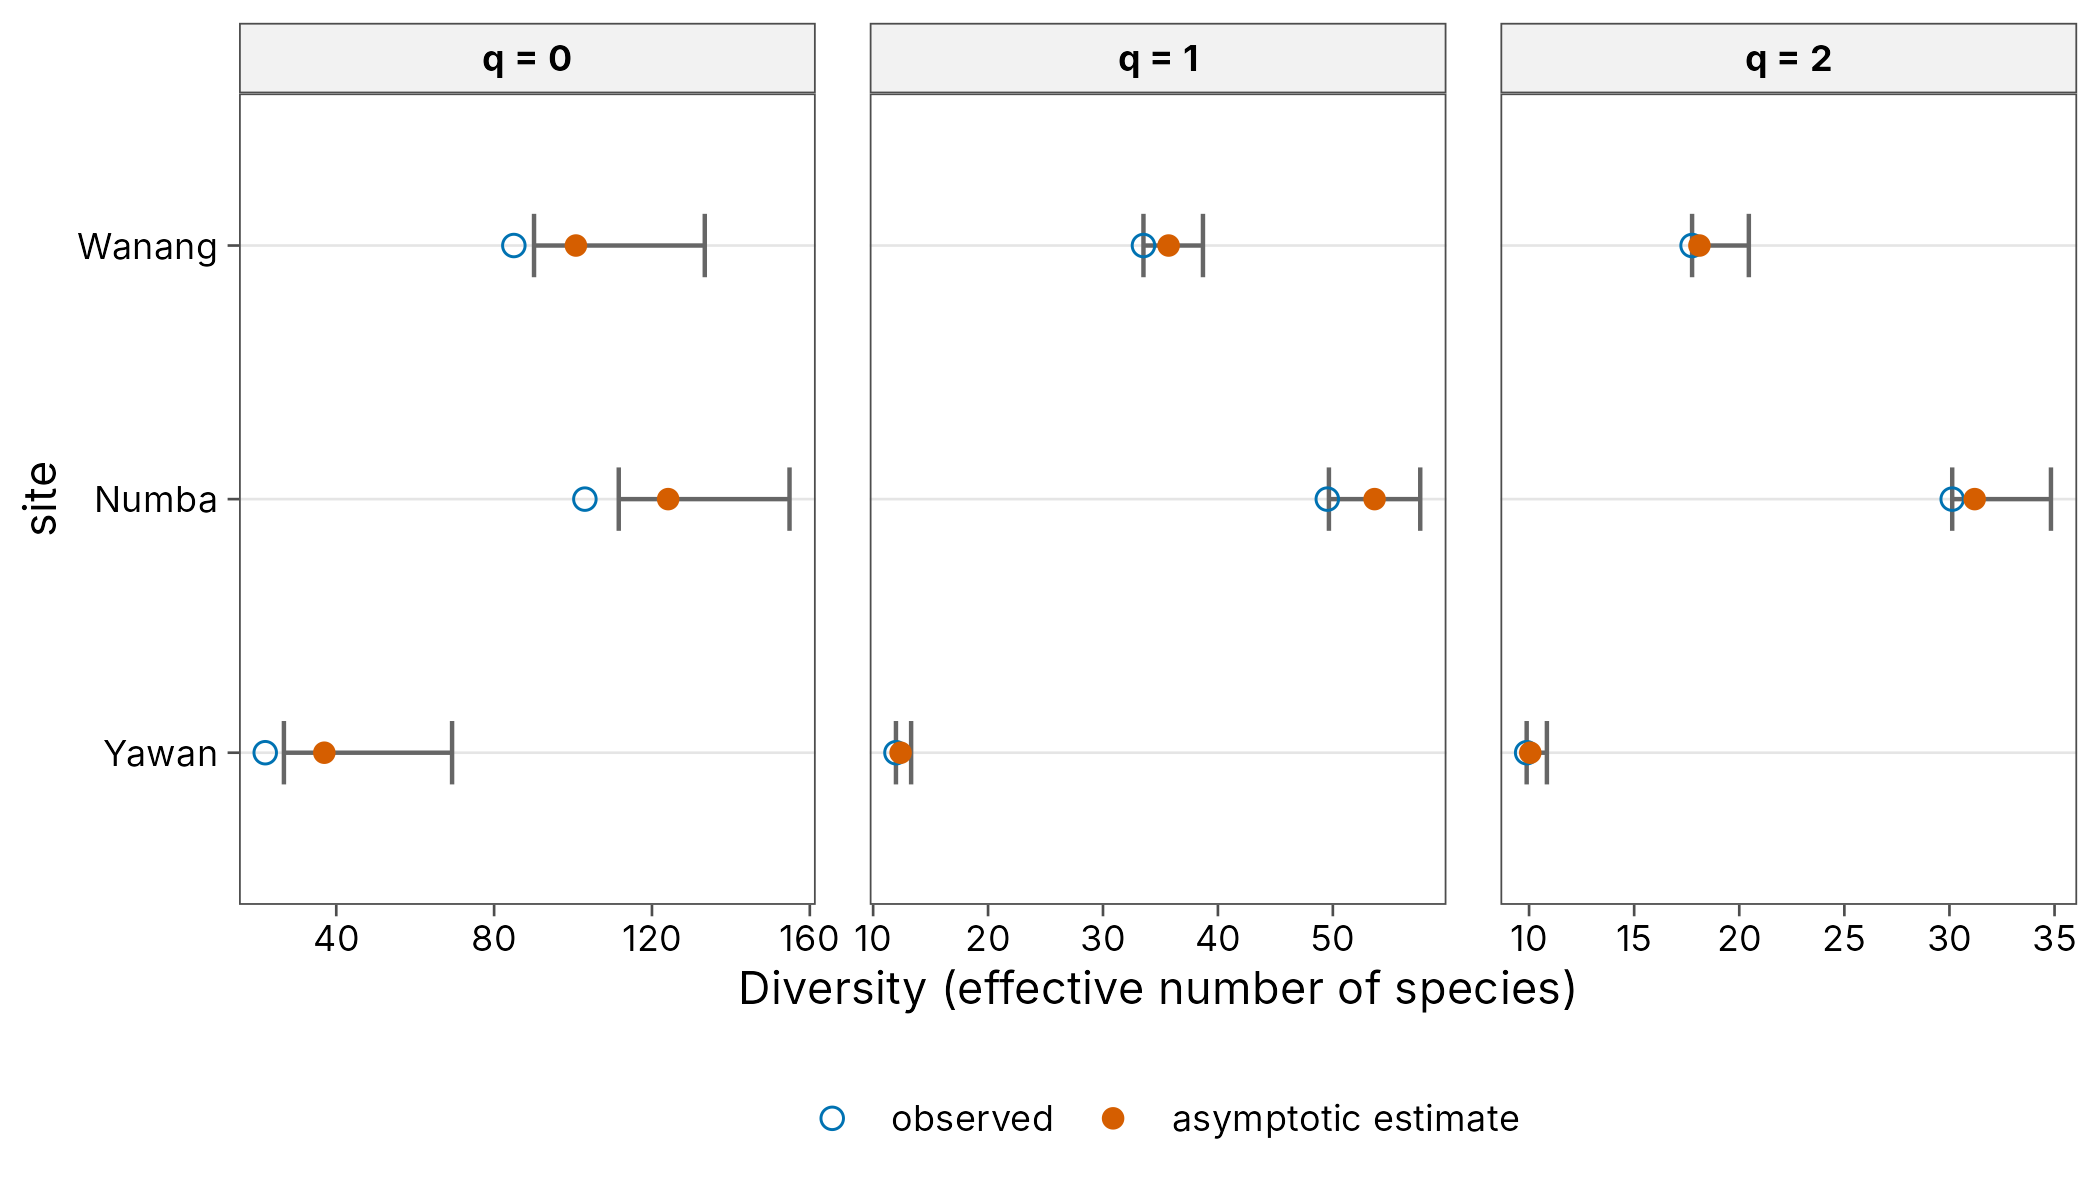
Diversity of every order peaks at mid elevation (Numba), as Plowman et al. (2020) reported. Estimated richness at Yawan has a wide interval because many species there were found only once.
Treating each tree as a site, almost all dissimilarity between trees is turnover rather than nestedness:
beta_multi(png_tree_ants, site = tree, .by = site)
#> # A tibble: 3 x 5
#>   site   n_sites turnover nestedness total
#>   <chr>    <int>    <dbl>      <dbl> <dbl>
#> 1 Wanang     326    0.991    0.00346 0.994
#> 2 Numba      224    0.986    0.00573 0.992
#> 3 Yawan      219    0.984    0.00570 0.990
References
Moses, J., Peters, M. K., Tiede, Y., Mottl, O., Donoso, D. A., Farwig, N., Fayle, T. M., Novotny, V., Sanders, N. J. and Klimes, P. (2023). Nutrient use by tropical ant communities varies among three extensive elevational gradients: a cross-continental comparison. Global Ecology and Biogeography, 32, 2212-2229. doi:10.1111/geb.13757
Plowman, N. S., Mottl, O., Novotny, V., Idigel, C., Philip, F. J., Rimandai, M. and Klimes, P. (2020). Nest microhabitats and tree size mediate shifts in ant community structure across elevation in tropical rainforest canopies. Ecography, 43, 431-442. doi:10.1111/ecog.04730