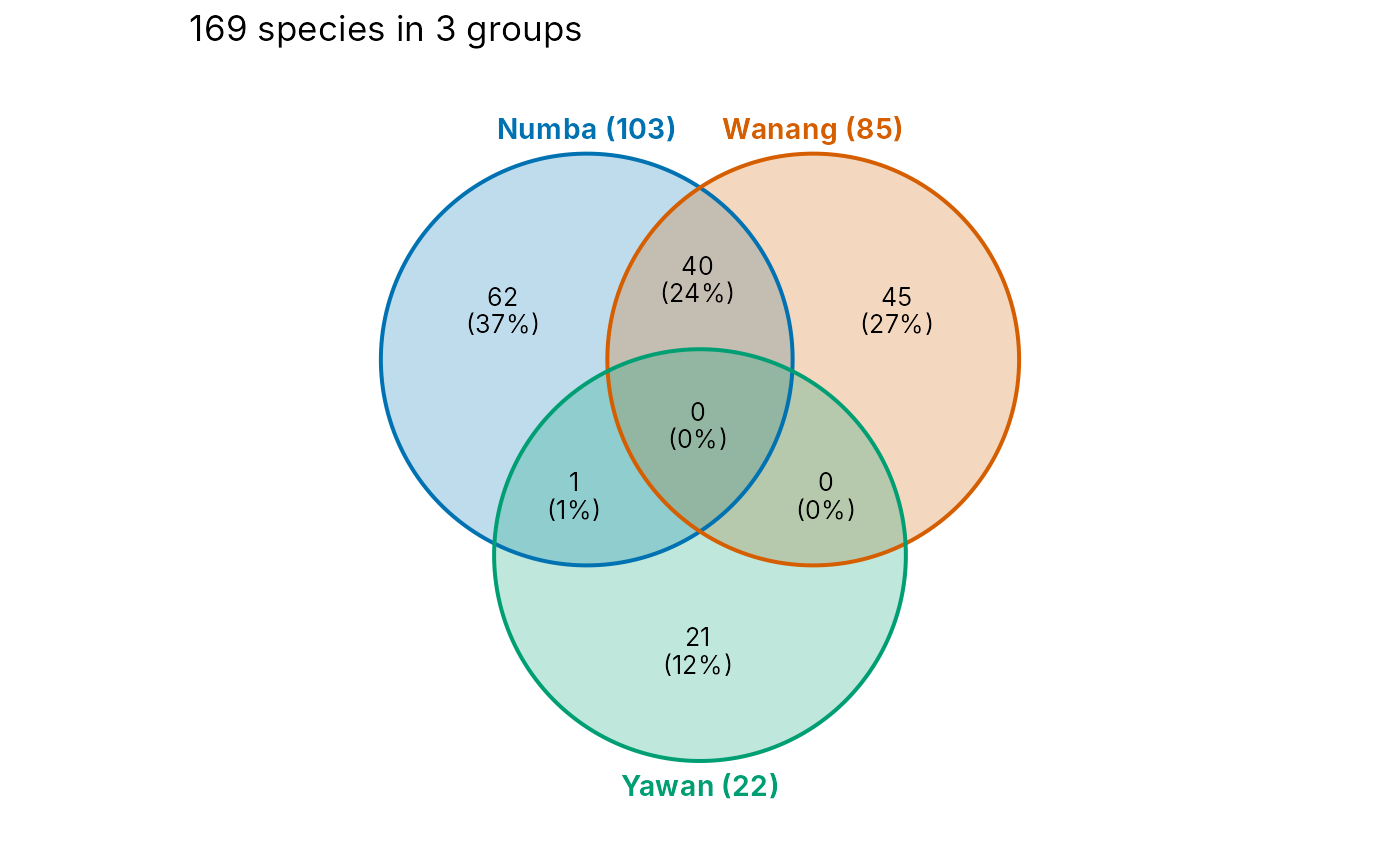
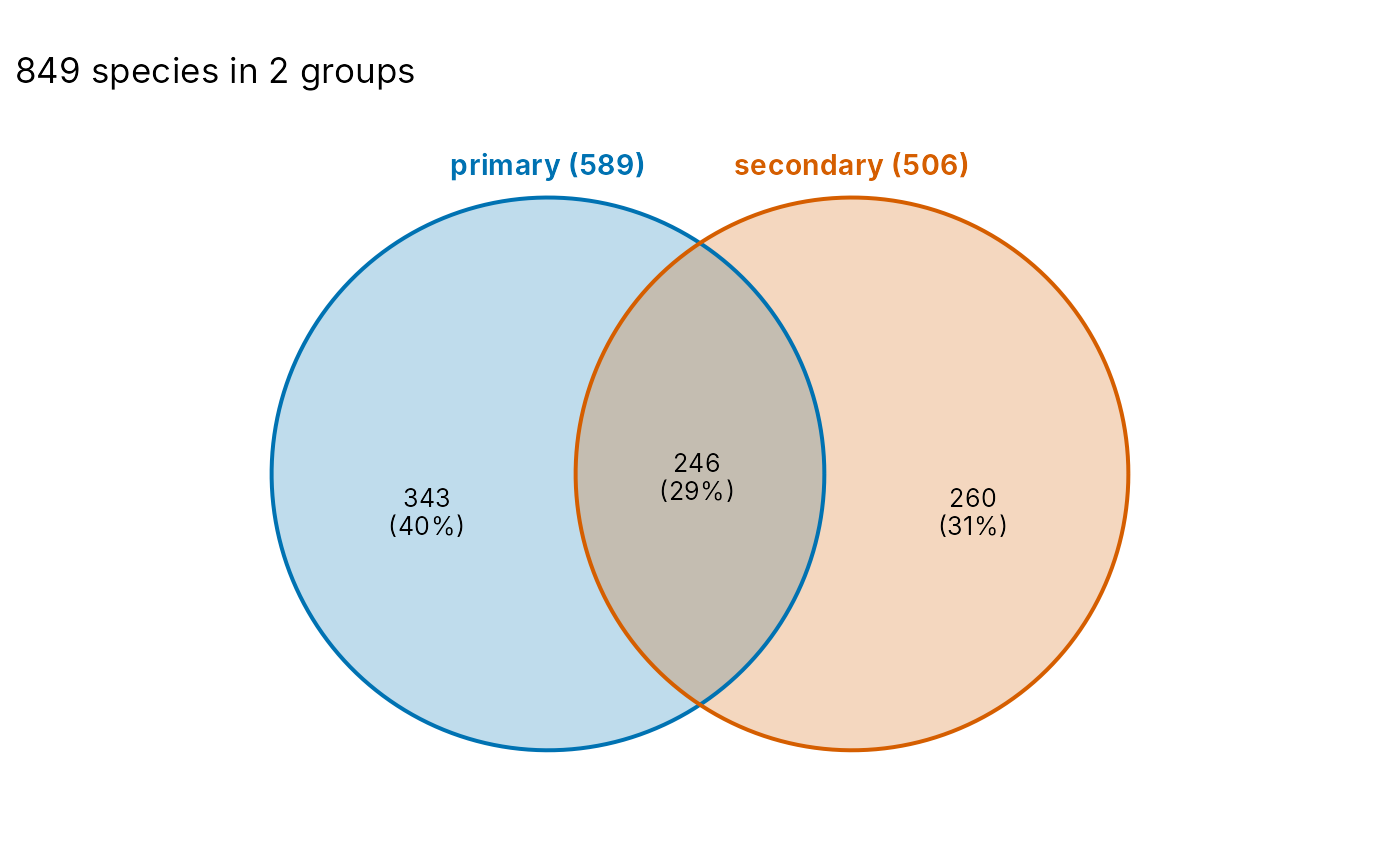
Draws a Venn diagram of the species recorded in two to four groups of sites, such as habitats or seasons. Each region shows the number of species found in exactly that combination of groups, and optionally their share of all species. Circles are used for two and three groups and ellipses for four, so that every combination has its own region.
Usage
plot_venn(
  data,
  group,
  species = species,
  percent = TRUE,
  palette = "okabe_ito",
  theme = theme_tidydiversity(grid = "none")
)
Arguments
- data
A data frame with one row per site (or sample) and species.
- group
The column defining the groups (two to four levels).
- species
The species column.
- percent
Also show each region's share of all species.
- palette
Colours for the groups:
"okabe_ito","grey"or a vector of colours.- theme
A ggplot2 theme, by default
theme_tidydiversity().