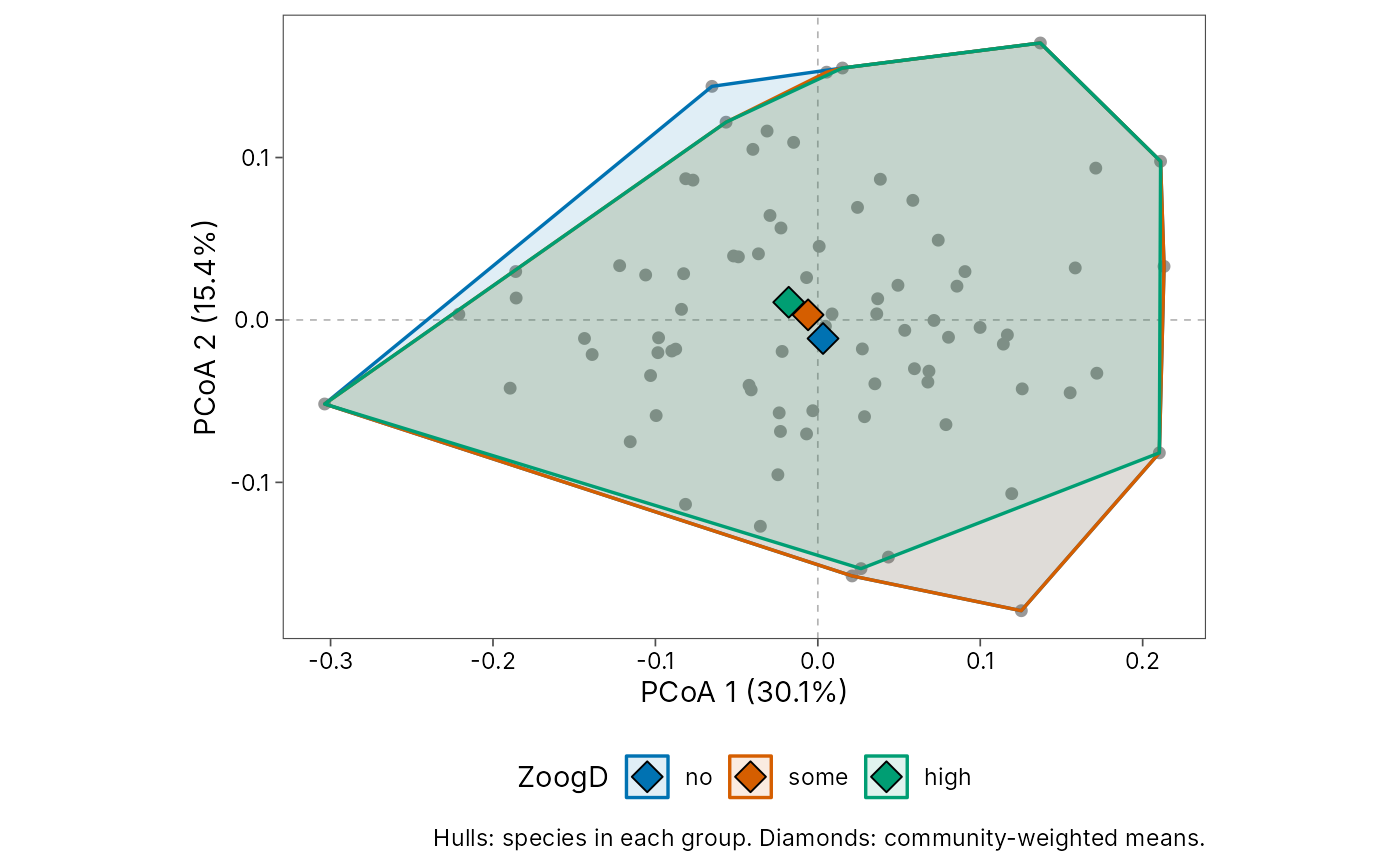
Places species in a two-dimensional functional trait space, the first
two axes of a principal coordinates analysis (PCoA) of their trait
dissimilarities, as is usual for multidimensional functional diversity
indices (Villeger et al. 2008). With data, each group of sites gets
the convex hull of the species it holds, whose area is the
two-dimensional functional richness, and its community-weighted mean
position (CWM).
Usage
plot_trait_space(
  traits,
  data = NULL,
  species = species,
  group = NULL,
  abundance = NULL,
  distance = NULL,
  labels = FALSE,
  palette = "okabe_ito",
  theme = theme_tidydiversity(grid = "none")
)
Arguments
- traits
A data frame with a species column and trait columns.
- data
Optional data frame of species records by group.
- species
The species column of
traitsanddata.- group
Column of
datadefining the groups to compare, such as habitats.- abundance
Optional abundance column of
data, used for the CWM.- distance
Optional species dissimilarities (a
distwith species labels). By default Gower distances fromtrait_dist().- labels
Label the species.
- palette
Colours for the groups:
"okabe_ito","grey"or a vector of colours.- theme
A ggplot2 theme, by default
theme_tidydiversity().
References
Villeger, S., Mason, N. W. H. and Mouillot, D. (2008). New multidimensional functional diversity indices for a multifaceted framework in functional ecology. Ecology, 89, 2290-2301. doi:10.1890/07-1206.1
Examples
aravo <- data_aravo()
plot_trait_space(aravo$traits, aravo$community, group = ZoogD, abundance = cover)