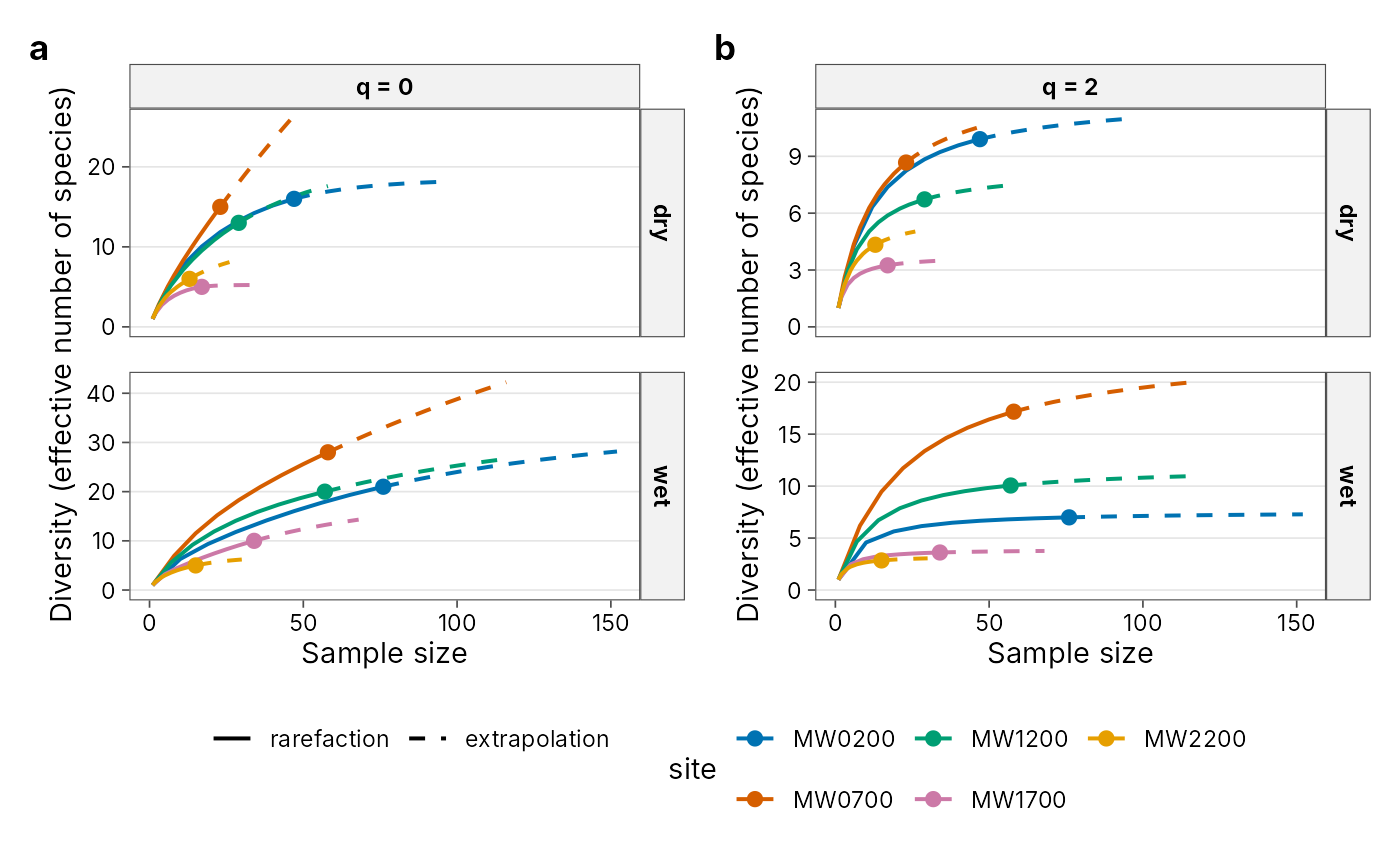
plot_panel() arranges ggplots (for example several autoplot()
results) into one multi-panel figure with
patchwork. It adds panel tags
(a, b, c, ...), collects shared legends and applies the tidydiversity
theme. The result is an ordinary patchwork object, so you can still add
patchwork::plot_annotation() or & theme changes.
Usage
plot_panel(
  ...,
  ncol = NULL,
  nrow = NULL,
  tag_levels = "a",
  tag_prefix = "",
  tag_suffix = "",
  guides = c("collect", "keep"),
  legend_position = "bottom",
  title = NULL,
  subtitle = NULL,
  caption = NULL,
  widths = NULL,
  heights = NULL
)
Arguments
- ...
ggplot objects, or one list of them.
- ncol, nrow
Layout grid, passed to
patchwork::wrap_plots().- tag_levels
Panel tag style:
"a","A","1","i","I", orNULLfor no tags.- tag_prefix, tag_suffix
Text around each tag, for example
"("and")".- guides
"collect"(default) merges identical legends;"keep"leaves them on each panel.- legend_position
Position of collected legends.
- title, subtitle, caption
Figure annotations.
- widths, heights
Relative panel sizes.
Examples
r0 <- div_rarefy(png_ants, q = 0, .by = season, knots = 20)
r2 <- div_rarefy(png_ants, q = 2, .by = season, knots = 20)
plot_panel(ggplot2::autoplot(r0), ggplot2::autoplot(r2), ncol = 2)